Power BI Learning Plan in 2025
|– Week 1: Introduction to Power BI
| |– Power BI Basics
| | |– What is Power BI?
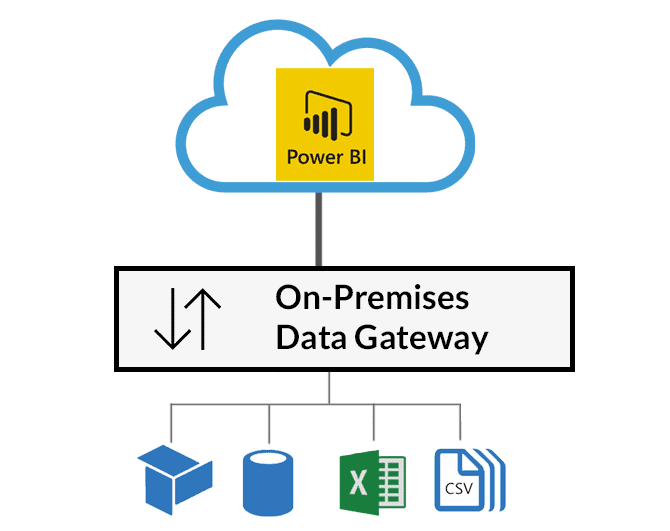
| | |– Components of Power BI
| | |– Power BI Desktop vs. Power BI Service
| |– Setting up Power BI
| | |– Installing Power BI Desktop
| | |– Overview of the Interface
| | |– Connecting to Data Sources
| |– First Power BI Report
| | |– Creating a Simple Report
| | |– Basic Visualizations
|
|– Week 2: Data Transformation and Modeling
| |– Power Query Editor
| | |– Importing and Shaping Data
| | |– Applied Steps
| |– Data Modeling
| | |– Relationships
| | |– Calculated Columns and Measures
| | |– DAX Basics
| |– Data Cleaning
| | |– Handling Missing Data
| | |– Data Types and Formatting
|
|– Week 3: Advanced DAX and Data Modeling
| |– Advanced DAX Functions
| | |– Time Intelligence
| | |– Iterators
| | |– Filter Functions
| |– Advanced Data Modeling
| | |– Star and Snowflake Schemas
| | |– Role-playing Dimensions
| |– Performance Optimization
| | |– Query Performance
| | |– Model Performance
|
|– Week 4: Visualizations and Reports
| |– Advanced Visualizations
| | |– Custom Visuals
| | |– Conditional Formatting
| | |– Interactive Elements
| |– Report Design
| | |– Designing for Clarity
| | |– Using Themes
| | |– Report Navigation
| |– Power BI Service
| | |– Publishing Reports
| | |– Workspaces and Apps
| | |– Sharing and Collaboration
|
|– Week 5: Dashboards and Data Analysis
| |– Creating Dashboards
| | |– Pinning Visuals
| | |– Dashboard Tiles
| | |– Alerts
| |– Data Analysis Techniques
| | |– Drillthrough
| | |– Bookmarks
| | |– What-If Parameters
| |– Advanced Analytics
| | |– Quick Insights
| | |– AI Visuals
|
|– Week 6-8: Power BI and Other Tools
| |– Power BI and Excel
| | |– Excel Integration
| | |– PowerPivot and Power Query
| | |– Publishing from Excel
| |– Power BI and R
| | |– Using R Scripts in Power BI
| | |– R Visuals
| |– Power BI and Python
| | |– Using Python Scripts
| | |– Python Visuals
| |– Power Automate and Power BI
| | |– Automating Workflows
| | |– Data Alerts and Actions
|
|– Week 9-11: Real-world Applications and Projects
| |– Capstone Project
| | |– Project Planning
| | |– Data Collection and Preparation
| | |– Building and Optimizing the Model
| | |– Creating and Publishing Reports
| |– Case Studies
| | |– Business Use Cases
| | |– Industry-specific Solutions
| |– Integration with Other Tools
| | |– SQL Databases
| | |– Azure Data Services
|
|– Week 12: Post-Project Learning
| |– Power BI Administration
| | |– Data Governance
| | |– Security
| | |– Monitoring and Auditing
| |– Power BI in the Cloud
| | |– Power BI Premium
| | |– Power BI Embedded
| |– Continuing Education
| | |– Advanced Power BI Topics
| | |– Community and Forums
| | |– Keeping Up with Updates
|
|– Resources and Community
| |– Online Courses (Coursera, edX, Udacity)
| |– Books (The Definitive Guide to DAX, Microsoft Power BI Cookbook)
| |– Power BI Blogs and Resources
| |– GitHub Repositories
| |– Power BI Communities (Microsoft Power BI Community, Reddit)
Hope it helps 🙂