
To address these challenges, a robust data analysis and reporting framework was implemented. Key metrics such as Total Loan Applications, Total Funded Amount, Total Amount Received, Average Interest Rate, and Average Debt-to-Income Ratio were centralized and calculated across both Month-to-Date (MTD) and Month-over-Month (MoM) intervals.
Interactive dashboards were developed to visualize trends and fluctuations in real time, enabling faster identification of emerging issues and lending opportunities. The system also allowed for automated updates and comparisons, improving the timeliness and accuracy of performance tracking.
As a result, Buea Scholars Credit Union significantly enhanced its visibility into portfolio performance, supported by data-driven insights that informed strategic decisions, optimized risk management, and improved member financial services.
NB: Client Requested All Values To Be In Dollars.
📈 Loan Analysis:
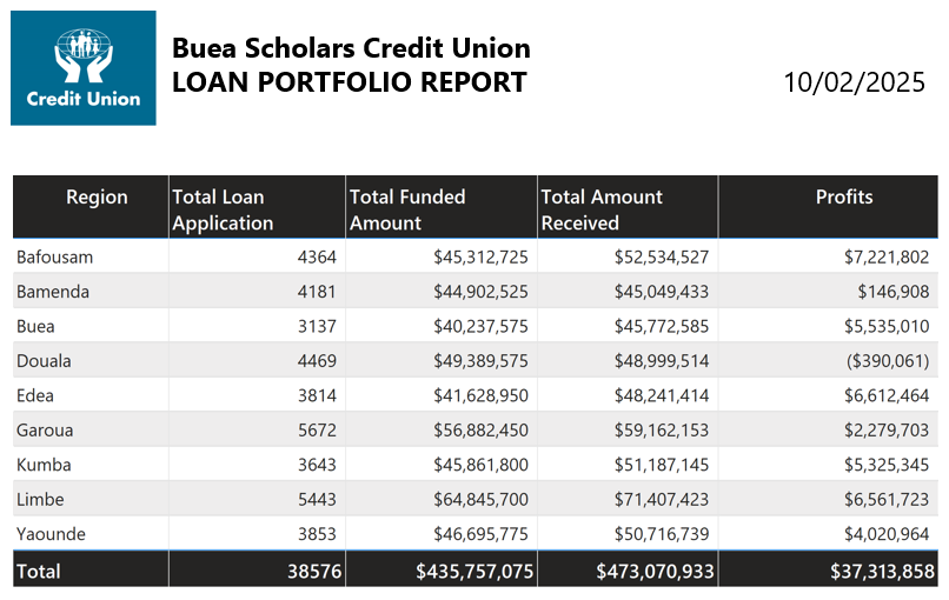
Total Loan Applications stood at 38,576, mean while the total funded amounts sum up to $435,757,075. The total amount that was received was $473,070,933. We further discovered that, among all loans granted, the %tage makeup of Good Loans stood at 86.2% while Bad loans stood at 13.8%.
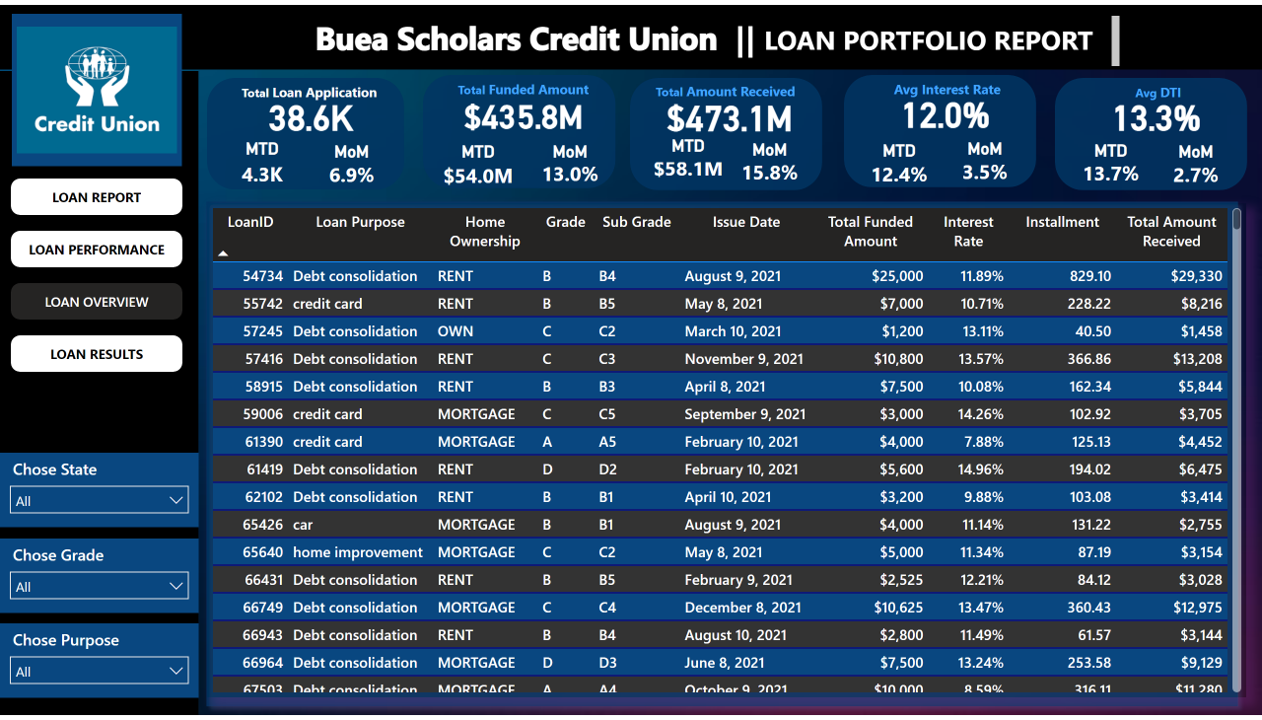
🚢Loan Status Grid View
In order to gain a comprehensive overview of our lending operations and monitor the performance of loans, we aim to create a grid view report categorized by ‘Loan Status.’ By providing insights into metrics such as ‘Total Loan Applications,’ ‘Total Funded Amount,’ ‘Total Amount Received,’ ‘Month-to-Date (MTD) Funded Amount,’ ‘MTD Amount Received,’ ‘Average Interest Rate,’ and ‘Average Debt-to-Income Ratio (DTI),’ this grid view will empower us to make data-driven decisions and assess the health of our loan portfolio.
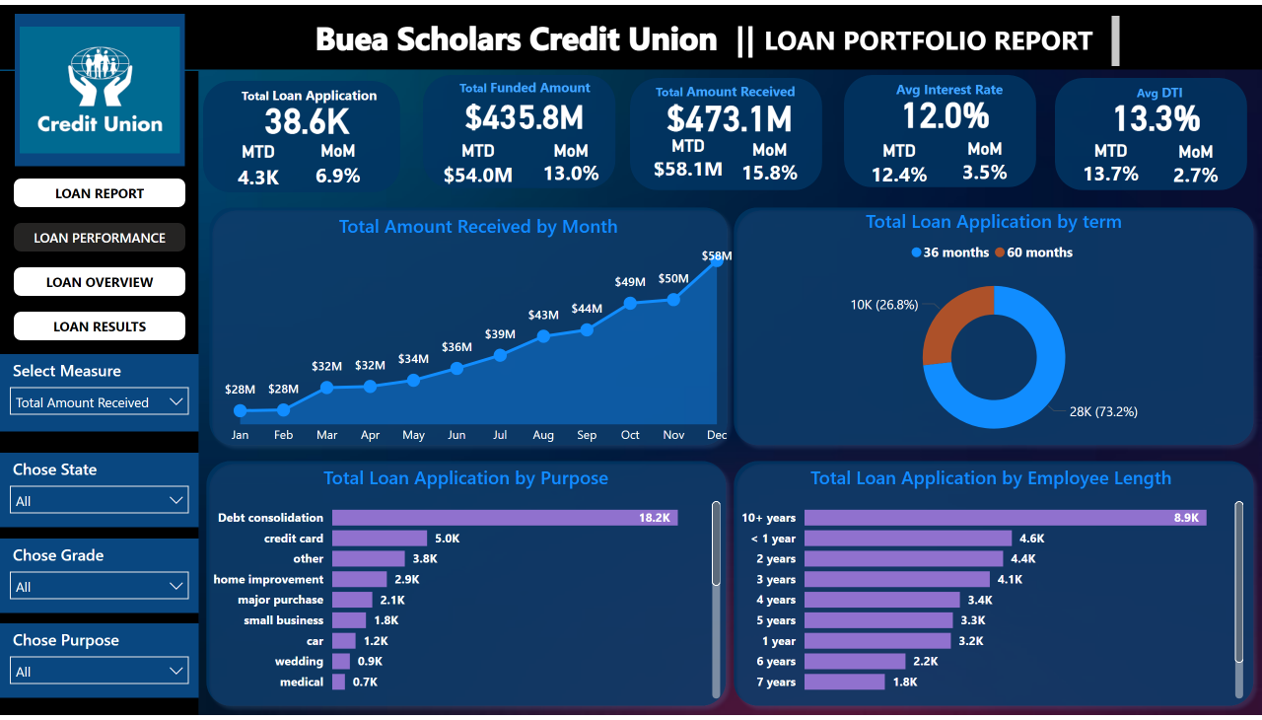
📊 Seasonality Trend
As part of the solution, two key visualizations were developed to enhance lending insights at Buea Scholars Credit Union. A line chart showing monthly trends by issue date was used to identify seasonality and long-term patterns in lending activities. Additionally, a donut chart provided clarity on loan term distribution, allowing stakeholders to easily understand how loans were spread across different term lengths. These visual tools supported more informed and strategic decision-making.
🚀 Strategic Actions & Recommendations
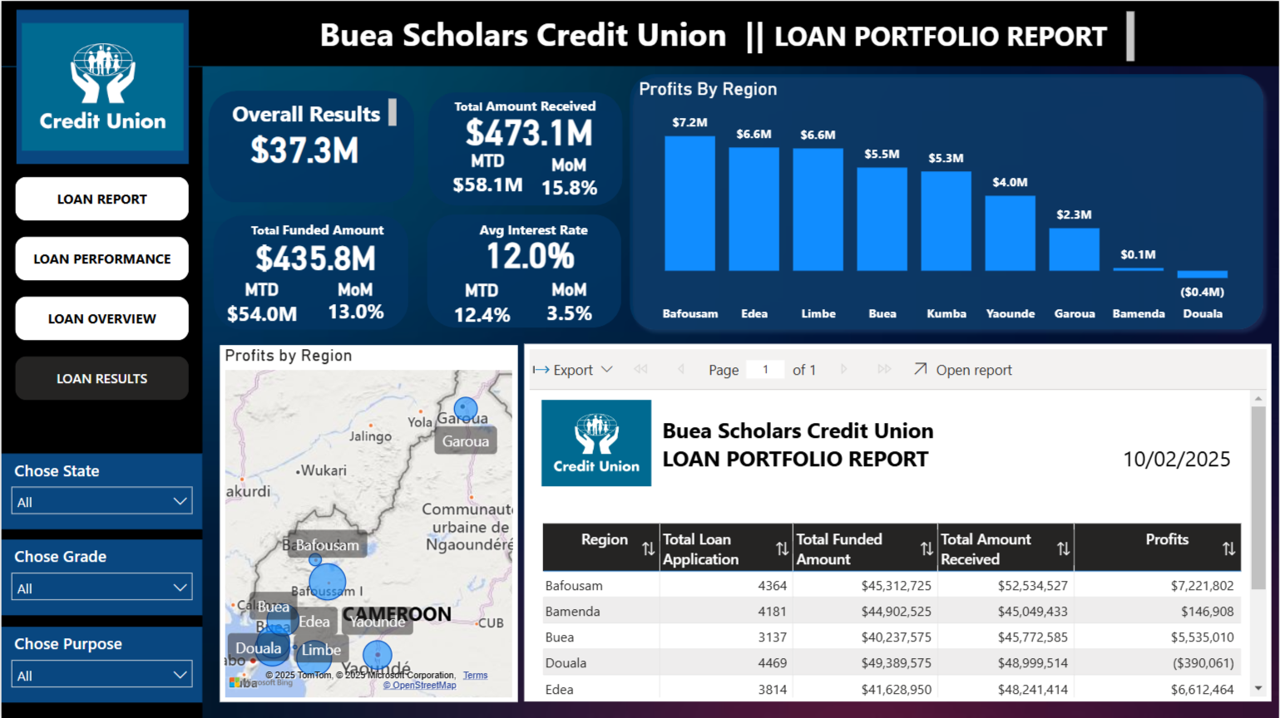
The analysis of Buea Scholars Credit Union reveals a significant discrepancy between Total loan Funded and Total Amount Received. Based on this , the credit union is doing well with an overall profit of $37.3M. While loan applications totaled a relatively modest 38.6k, the credit union funded $435.8M and received $473.1M. This substantial difference suggests several potential areas for further Investment.
Loan Portfolio Composition: The relatively low percentage of bad loans (13.8%) compared to good loans (86.2%) indicates a generally healthy loan portfolio. However, Let’s build on this momentum by continuing to embrace challenges, collaborate effectively, and stay focused on our shared vision. The future is bright, and together, we’ll achieve even greater success.
Recommendation: More good loans should be granted, while paying attention to the Douala Branch that is making a significant loss of $390k. More training on loan analysis and risk assessment should be done.
🚢 Regional Analysis & Paginated Report
A map enabled regional analysis by regions, helping to pinpoint areas with significant lending activity and highlight regional disparities.
I am specialize in transforming data into actionable insights. From interactive dashboards to robust cloud solutions, I empower teams to make informed decisions with clean, clear, and secure data.
Got a project? Need help with data or dashboards?
Reach out and let’s talk.
Copyright © 2025 BDI | Designed with ❤ by Stillwaters @gency