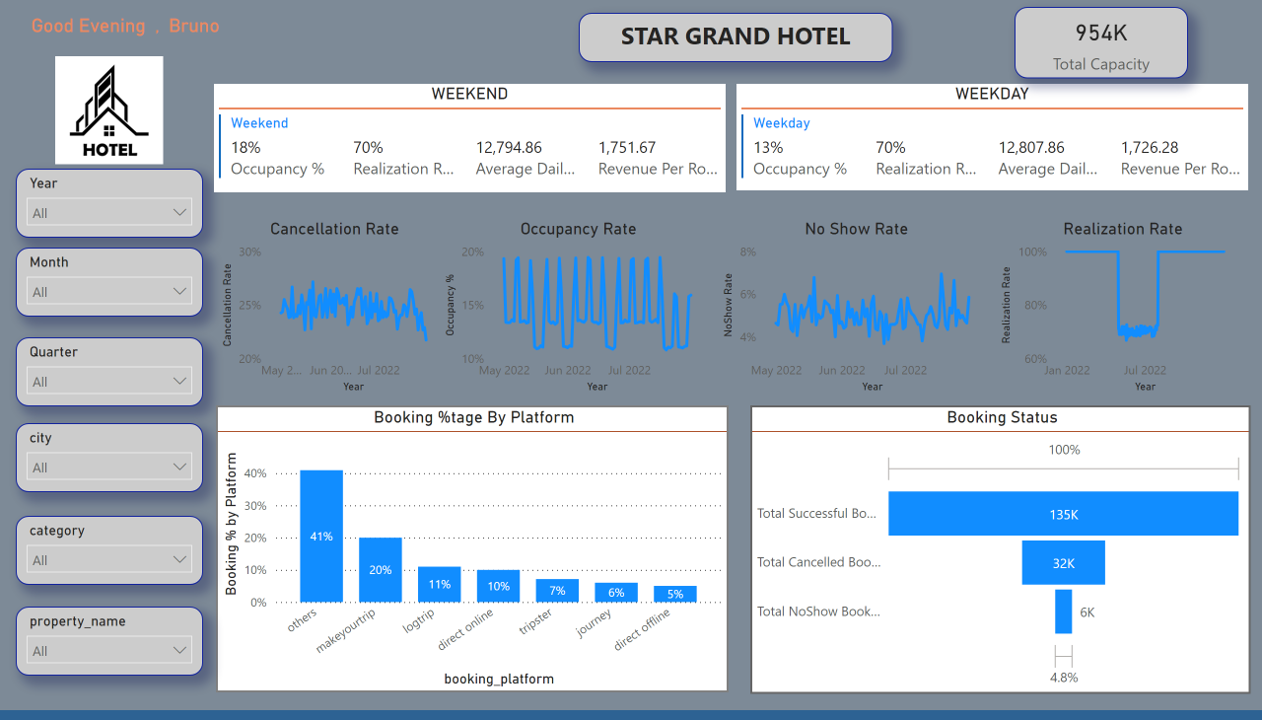
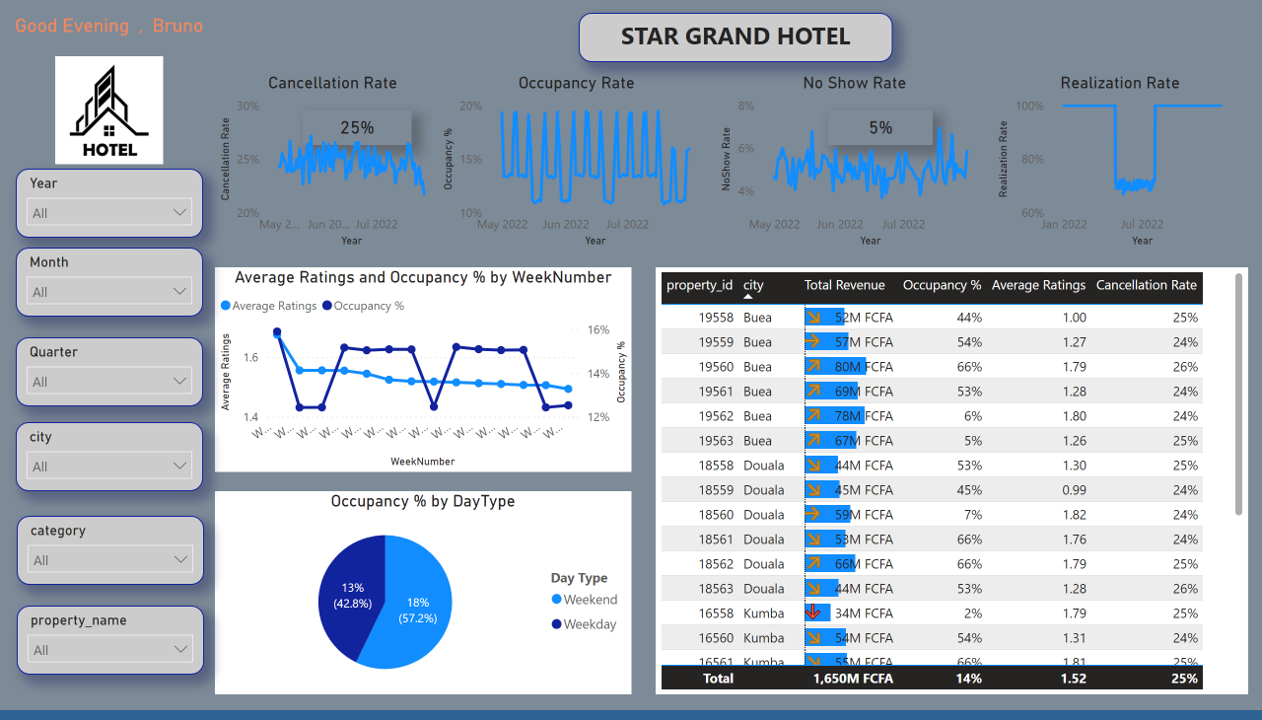
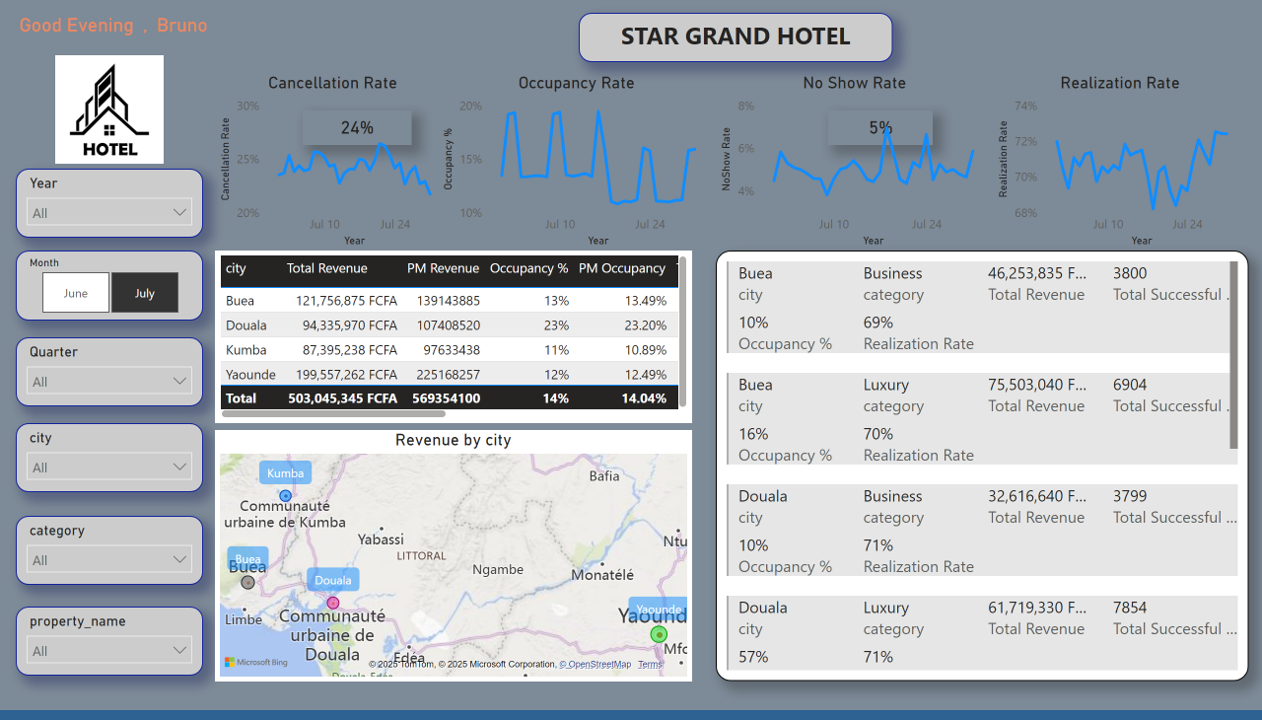
This project addresses these challenges through a comprehensive data analysis approach, including Exploratory Data Analysis (EDA), key metric tracking (Revenue, ADR, RevPAR, Occupancy), and Week-over-Week (WoW) performance evaluation. By analyzing patterns in bookings, cancellations, platform usage, and room class preferences, the goal is to uncover actionable insights that drive smarter decision-making.
Dashboard Creation
Create dynamic dashboards to display:
Performance Reporting
The final deliverables include dynamic dashboards and performance reports that provide a clear view of business performance, highlight areas for optimization, and support data-driven strategies for increasing guest satisfaction and profitability.
📈 Regional Revenue Analysis: Yaoundé with Highest Revenue of 199,557,262 fcfa
✅Calculate Revenue per Category: Luxury was making the highest revenue of 75,503,040 fcfa.
📊Occupancy Analysis: Occupancy stood at 18% during weekends & 13% during weekdays.
🚢NoShow and Cancellation Analysis: Cancellation rates where 24% & NoShow Rate at 5%.
🙋🏽Booking %tage by Platform: Other platforms dominates with 41%, direct offline stood at 5%.
I am specialize in transforming data into actionable insights. From interactive dashboards to robust cloud solutions, I empower teams to make informed decisions with clean, clear, and secure data.
Got a project? Need help with data or dashboards?
Reach out and let’s talk.
Copyright © 2025 BDI | Designed with ❤ by Stillwaters @gency