
To address the challenges faced in analyzing water quality sensor data across Europe, the project proposes a comprehensive Power BI solution. First, raw datasets will be imported and cleaned to ensure consistency in format and structure. Relationships between datasets will be modeled to allow seamless integration of location, time, and sensor variables. Using DAX (Data Analysis Expressions), calculated measures and KPIs will be created to support in-depth analytical insights.
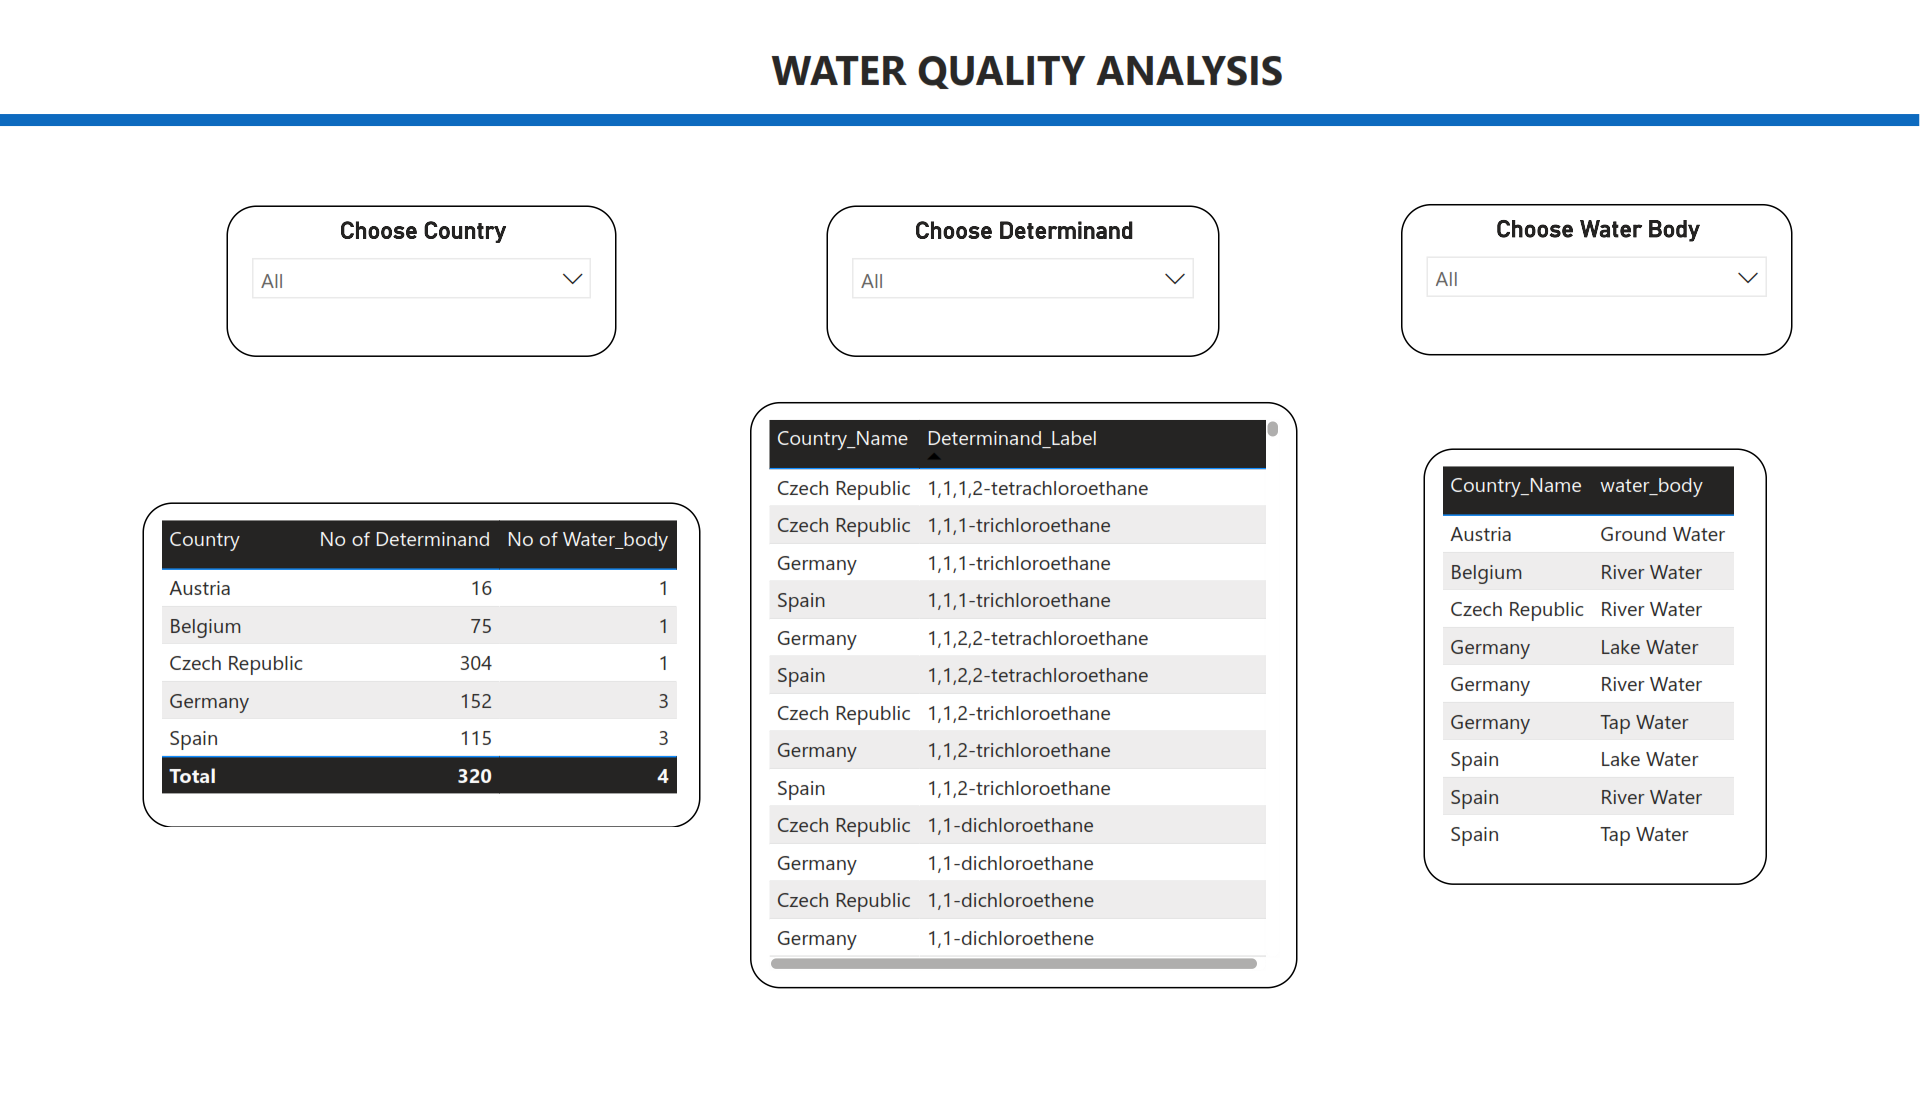
Interactive dashboards will be developed to visualize trends, outliers, and comparisons across countries and time periods, aiding early detection of anomalies and long-term environmental patterns. Features like drill-through, slicers, and filters will be leveraged to enable granular exploration of data by region, sensor type, or regulatory threshold.
Furthermore, the use of collaborative sharing tools in Power BI will ensure insights are accessible to stakeholders, supporting transparent and informed decision-making. This structured analytical approach will not only enhance monitoring capabilities but also assist in aligning operations with regulatory standards and sustainability goals.
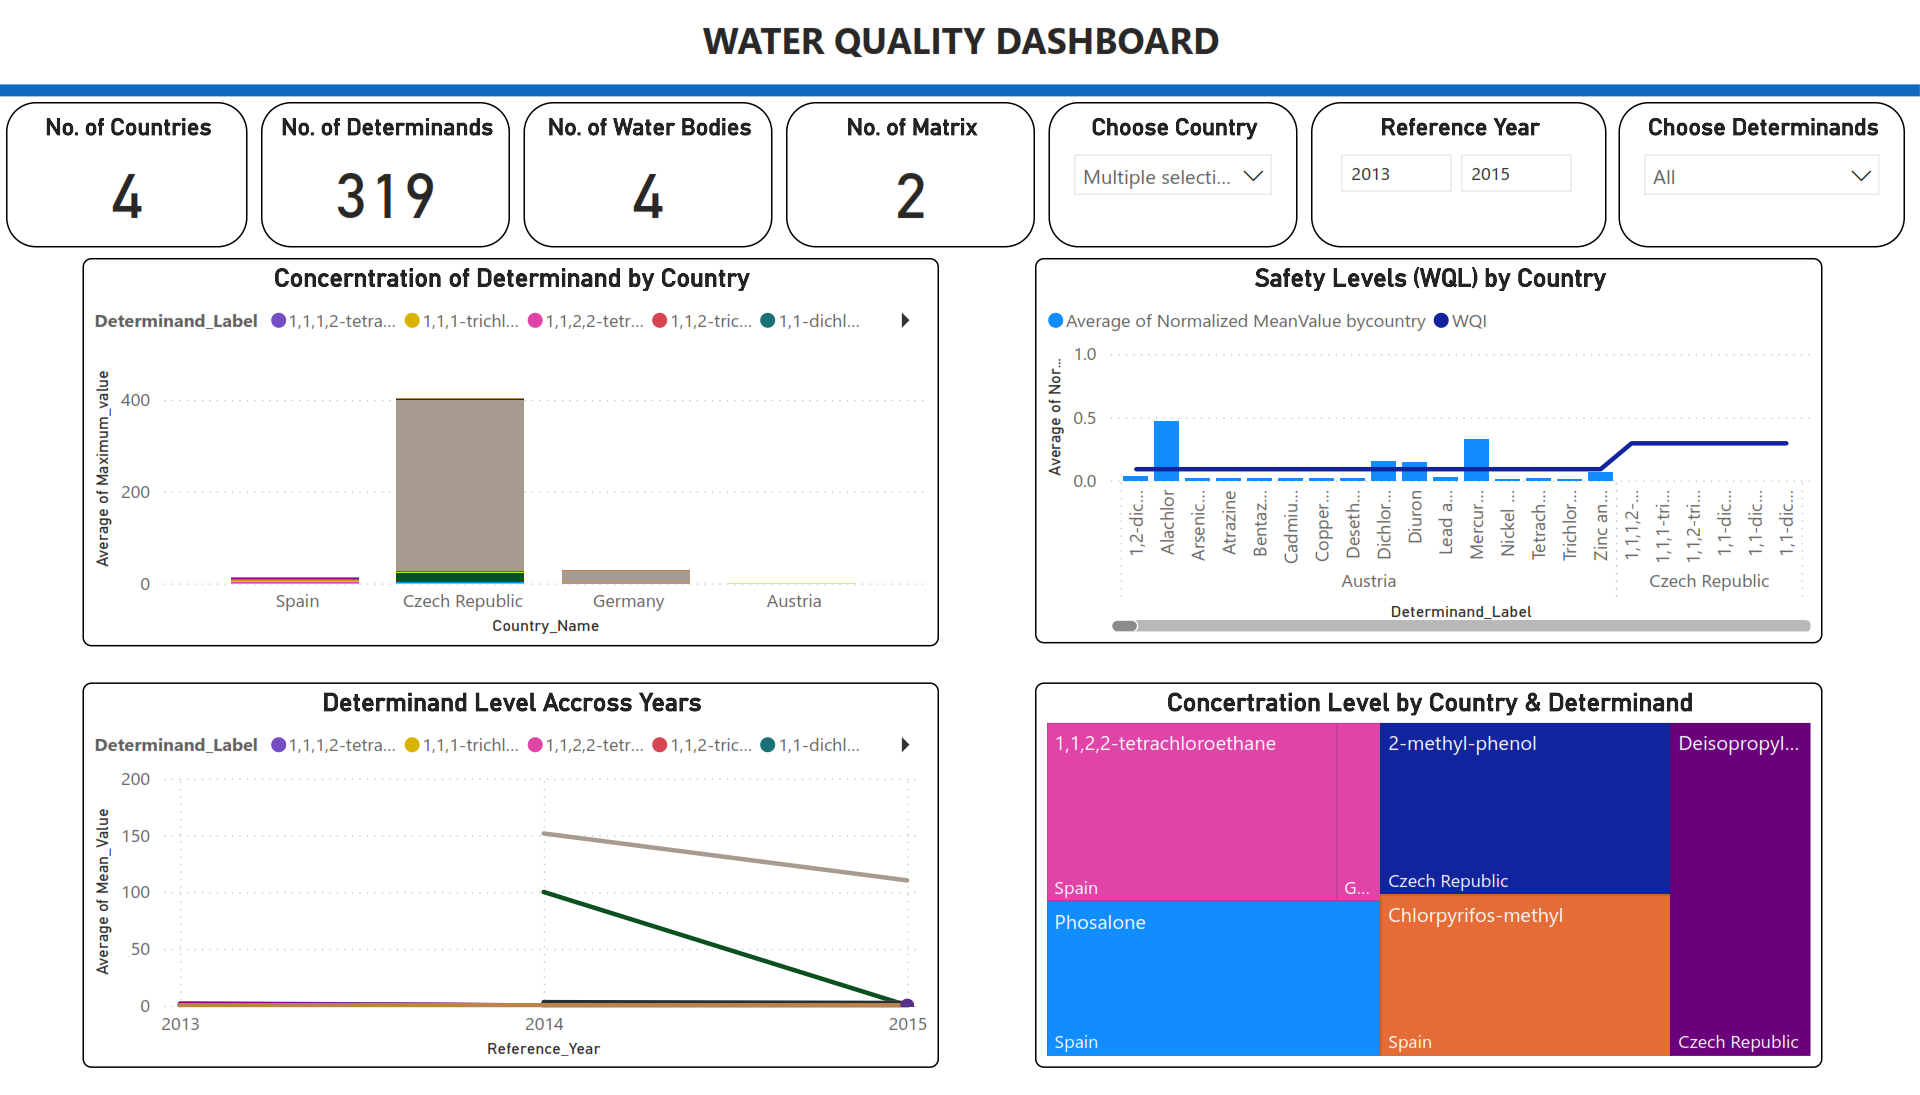
The analysis yielded several meaningful insights from the water quality sensor data across European countries. By leveraging Power BI, the raw and inconsistently formatted datasets were successfully transformed into an interactive and insightful reporting solution. Key results include:
Trend Analysis: Clear patterns of seasonal fluctuations and long-term trends in key water quality indicators (e.g., pH levels, nitrate concentration, turbidity) were identified across different countries and water sources.
Anomaly Detection: The dashboards highlighted several anomalies such as sudden spikes in pollutant levels and irregular sensor readings, enabling early warning for potential environmental hazards.
Comparative Insights: Cross-country comparisons revealed significant differences in water quality standards and performance, supporting benchmarking efforts and highlighting best practices in regional water management.
I am specialize in transforming data into actionable insights. From interactive dashboards to robust cloud solutions, I empower teams to make informed decisions with clean, clear, and secure data.
Got a project? Need help with data or dashboards?
Reach out and let’s talk.
Copyright © 2025 BDI | Designed with ❤ by Stillwaters @gency