
🔍 Power BI Skills Every Data Analyst Should Master
In today’s data-driven world, businesses rely on real-time insights to make strategic decisions—and Power BI is at the heart of this transformation. Whether you’re an aspiring data analyst or looking to level up your current skill set, mastering Power BI can give you a serious edge in your career.
1. Data Import & Transformation (Power Query)
Before any analysis begins, raw data needs cleaning and shaping. Power BI’s Power Query Editor is where you handle:
-
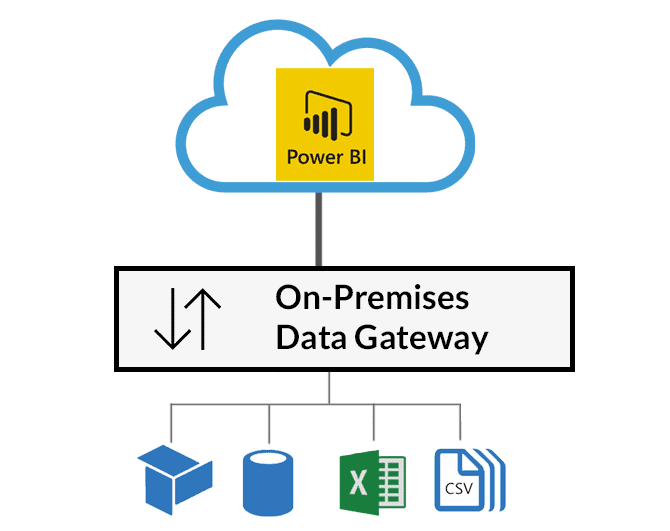
Data import from multiple sources (Excel, SQL, web, APIs)
-
Removing errors, duplicates, and null values
-
Merging, appending, and pivoting/unpivoting data
-
Creating custom columns and filters
📌 Why it matters: Clean data is the foundation of accurate analysis.
2. Data Modeling & Relationships
Understanding how to build a proper data model separates beginner reports from professional analytics. Key skills include:
-
Creating relationships between tables
-
Setting primary keys and foreign keys
-
Understanding star and snowflake schemas
-
Using fact and dimension tables efficiently
📌 Why it matters: A well-structured model ensures smooth performance and reliable measures.
3. DAX (Data Analysis Expressions)
DAX is the formula language behind Power BI. Mastering it allows you to:
-
Create calculated columns and measures
-
Write time-intelligent calculations (YoY, MoM, MTD, etc.)
-
Perform advanced filtering, aggregation, and ranking
-
Build KPIs and dynamic visuals
📌 Why it matters: DAX turns your data into powerful insights.
4. Interactive Visualizations & UX Design
Good data analysts know that how you present insights matters. Learn how to:
-
Choose the right chart types (bar, line, waterfall, KPI cards, etc.)
-
Use slicers, drill-throughs, bookmarks, and tooltips
-
Customize dashboards for mobile and desktop views
-
Apply themes and clean layouts for better storytelling
📌 Why it matters: Clear visuals drive better decisions.
5. Power BI Service & Collaboration
Once your report is ready, publishing and sharing it is key. You should be comfortable with:
-
Publishing reports to the Power BI Service
-
Creating dashboards from published reports
-
Setting up scheduled refresh and row-level security
-
Sharing reports and collaborating within workspaces
📌 Why it matters: Business value is only realized when insights reach decision-makers.
6. Performance Optimization
As your datasets grow, performance becomes crucial. Learn techniques to:
-
Optimize DAX queries
-
Use aggregation tables
-
Limit visuals and interactions for speed
-
Manage data refresh schedules
📌 Why it matters: Faster reports = happier stakeholders.
7. Real-World Projects & Case Studies
Finally, build a portfolio of end-to-end Power BI projects. Focus on domains like:
-
Sales & marketing analytics
-
Financial performance dashboards
-
Supply chain and inventory tracking
-
Healthcare, education, or environmental data
📌 Why it matters: Practical experience beats theory every time.
🚀 Final Thoughts
Power BI is more than just a reporting tool—it’s a powerful platform for transforming data into strategy. By mastering these core skills, you’ll not only enhance your data analysis capabilities but also become an indispensable asset to any organization.
Ready to get started? Start small, practice daily, and let your visuals do the storytelling.